Step-by-step:
1. Go to Schedule > Engagement Radar
Under Baseline measurement, click on “Schedule measurement”:

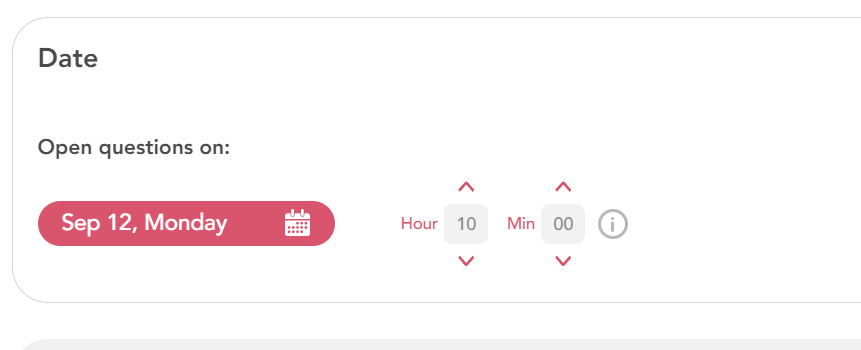
2. Decide when questions should be sent (default settings)
Decide when you want the questions to open by selecting a date and a time. By default, the questions will close for answering until Sunday 24.00 and the results are out Monday morning.
To note: If you would like to extend the survey to two weeks or change the end date, see step 3 in this guide.
3. Decide when questions should close (advanced settings)
By activating the advanced settings you can tailor which day the questions will close. A pulse can stay open for a maximum of two weeks, Monday to Sunday the week after.
To note: Regardless of which day the questions close, the final results (for example the final response rates, KPI:s and exports) will always be available on Monday the week after the pulse closes.
4. Results visibility (default settings)
The next step is to decide the result visibility settings, which determine what the managers and users will see from the results.
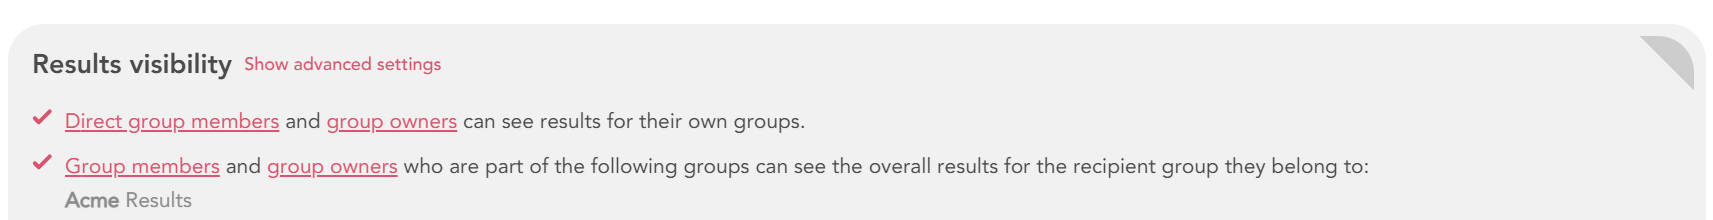
The default settings for results visibility will allow users and managers to see:
- Their own individual answers
- Results for the groups they are a direct member in, owner of, or have viewing rights to
- Overall results for the recipient group they belong to
5. Results visibility (advanced settings)
To note: If you would like to keep the default standard results visibility settings as they are - proceed directly to the next step in this guide.
With the advanced settings, you have many options to customize the results visibility for your scheduling.
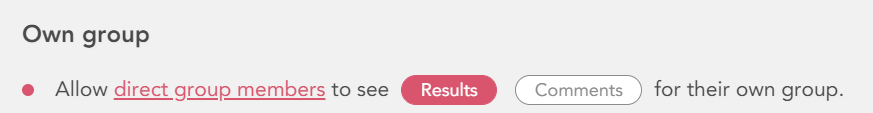
Advanced settings for the individuals’ own group:
The first step in the advanced results visibility settings is to decide desired visibility for the individuals’ own group.
What is the “Own group”?
The own group is the group that the individual is either a:
- Direct member of
- The group owner of
- Have viewing rights to
Do you want to learn more about what a direct group member is? Read this guide.
Decide if you want to give results and/or comments visibility for groups that the individuals’ are direct members of:
Decide if you want to give results and/or comments visibility for groups that the individuals’ are group owners of or have viewing rights to:

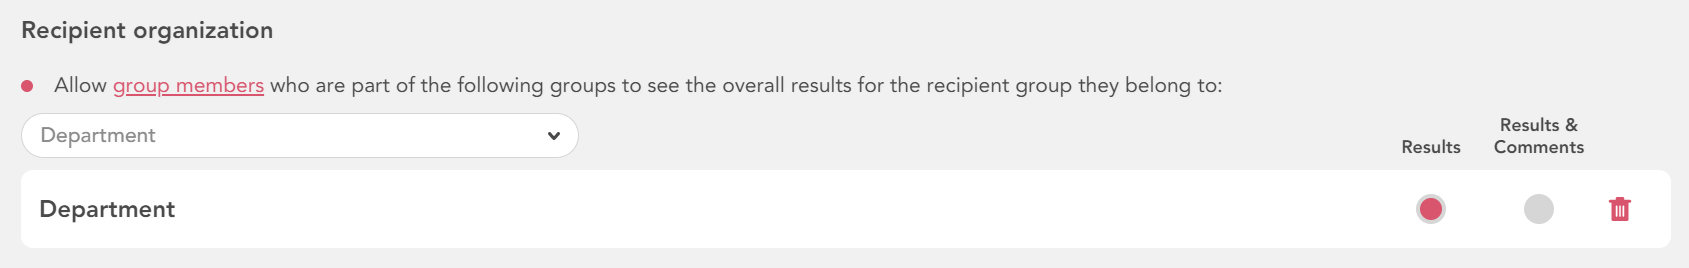
Advanced settings for the individuals’ recipient organization:
The second step in the advanced results visibility settings is to decide desired visibility for the individuals’ recipient organization.
What is the “recipient organization”?
The recipient organization is the group/groups that have been selected in the Recipient menu (see step number 3 in this guide).
In the section “Recipient organization” you can add additional results visibility. You can decide if you for example want employees and/or managers to see the overall results for the whole organization or their own department.
Select the groups that you want members (usually employees) to see results and/or comments for. The group members will only see results for the selected group(s) to which they belong to:
Select the groups that you want group owners (usually managers) to see results and/or comments for. They will only see results for the selected group(s) to which they belong to:
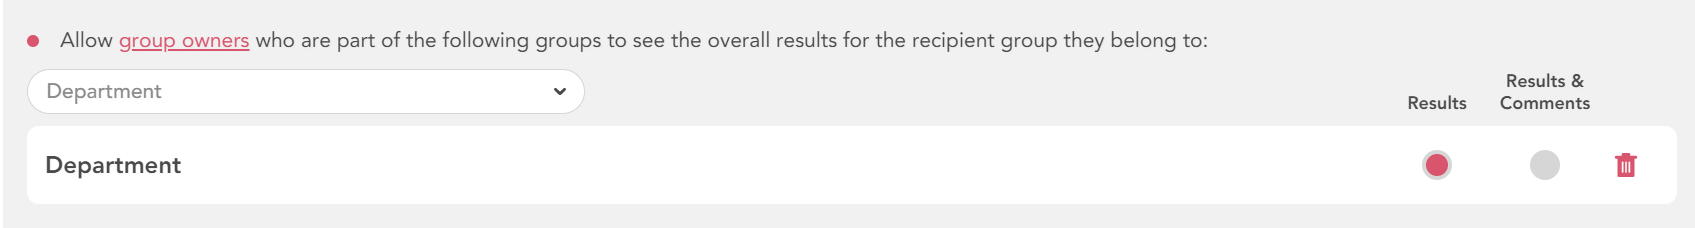
To note: group members and owners will not be able to see results for groups they don't belong to. They can only see total results for the selected group if they are a member or owner of a subgroup.
6. Click on start to complete the scheduling of the Baseline measurement.
